Wokeness: the far right’s last scapegoat
“Do-gooders” are no longer just a nuisance – their “decadence”, according to populist demagogues, is now an existential threat to civilisation

“Right on”. “Politically correct”. “PC”. “Social justice warriors”. “Virtue signallers”. Now “woke”. Rightwingers and authoritarians of all stripes have been sneering at liberals, leftwingers and anyone with a conscience for at least 50 years, and the onslaught has intensified in step with social media’s dominance of the infosphere.
But recently, there’s been a noticeable increase in stridency – and a worrying raising of the stakes.
Whereas not so long ago, people who discussed pronouns, chucked statues into rivers and sat on roads were merely a nuisance, of late they have evolved, if we are to believe some commentators, into a clear and present danger to our way of life. It turns out they’re not just a symptom of the collapse of democracy in the western world, but a root cause.
Current Tory party chair and former anti-culture culture secretary Oliver Dowden, in a speech to the Heritage Foundation in February, talked of the west being “in the clutches of a painful woke psychodrama”, afflicted by a “dangerous form of decadence”; Sherelle Jacobs delivered a pale imitation of his pale speech in the Telegraph; while Matthew Syed in the Times bewailed the “poison introduced into the vitals of the system” (paywall). As usual, these talking points have been taken up and repeated, usually verbatim, across the political right.
But unlike the hordes of reflexive retweeters, I have questions.
1. What do they mean by decadence exactly? What form is this terrifying descent into depravity supposed to be taking, and how is it unfolding?
Decadence comes from the same root as the word decay, and as I used to understand it, means something not dissimilar: a marked deterioration in standards, of art, for example, or of the values of a nation.
And indeed, such matters have been the bugbear of small- and capital-C conservatives since time immemorial: think the original Cancel Queen, Mary Whitehouse, having an embolism over Chuck Berry’s My Ding-a-Ling (before presenting Jimmy Savile with an award for “wholesome family entertainment”), or Catholics soiling their cassocks over a collectible card game.
It has also, we should remember, been an obsession for some of the west’s bitterest enemies. Adolf Hitler outlawed all “degenerate” art as “cultural Bolshevism” (in his view, cultural degeneracy went hand in hand with physical degeneracy); Osama bin Laden demanded that the west “reject the immoral acts of fornication, homosexuality, intoxicants, gambling, and trading with interest”; while Josef Stalin kept the peasants on side partly by issuing endless direful warnings about the decadence and cruelty of the west.
But it doesn’t seem to be that sense of decadence that Dowden, Jacobs and Syed are fretting about. Their diatribes make no mention of fornication, slovenliness or drug-taking, of violent computer games or the corruptive influence of the Teletubbies. In fact, you have to go through all three jeremiads with a fine toothcomb to find any examples of the hell-in-a-handbasket horrors they’re deploring.
Syed’s piece contains a throwaway line about the “infiltration of the universities” (for which he fails to provide any evidence, or indeed any hint as to what shadowy cabal might be masterminding it), but it’s mostly an attack on “me first” society, global finance and British foreign policy of the last 30 years. Can the blame for any of that really be laid at the door of human rights lawyers or Just Stop Oil, whose byword is “me last” and who are generally bitterly opposed to the financial and petrochemical giants and the concept of war?
Ordinarily, I’d presume that Syed was ordered to shoehorn in the anti-woke lines by his editor at the Times, but the writer himself chose to promote it on Twitter with the following quote:
While Xi Jinping was resetting the world order through his Belt and Road initiative and Vladimir Putin was recreating the Russian empire by annexing Georgia and Crimea, we were arguing over gender-neutral toilets
Matthew Syed, Twitter, 6/3/22
It’s certainly clickbaity, and, as was undoubtedly intended, duly generated its fair share of pop-eyed “debate” on everyone’s favourite social media battlefield. But as with most clickbait, it’s a bunch of shit.
For one thing, as a comparison, it’s up there with the far right’s very worst for sheer asininity. Are we really supposed to accept that the geopolitical policy decisions of the unassailable ruler of a major world power are equivalent to the bickerings of a handful of 19-year-old Durham University students? Mightn’t those worthy woke warriors be setting their sights a little higher than questions of bathroom access if they had the economic, cultural and military might of a nation of 1.3 billion people behind them?
Syed is also guilty of the same fallacy as the commentators who burst a blood vessel whenever they chance upon a new “woke” initiative in the police force: “Perhaps the police should spend less time filling in forms and more time solving murders!”
The latter point relies on the bizarre assumption that the police force is some sort of monolithic entity that can focus only on one activity at a time, rather than a heterogeneous organisation made up of multiple forces consisting of hundreds of thousands of individuals with different skills, responsibilities and specialisms. Syed’s zinger is predicated on the similar idea that the entirety of the United Kingdom is permanently engaged in trivial squabbles while all of China is Greatly Leaping Forward, when in truth the only people devoting more than a few seconds a year to these culture war issues are a small crowd of earnest lefties and the far-right commentators who’d be hunting down Jack Monroe recipes without them.
Dowden’s Heritage Foundation homily is equally free of substance, consisting mostly of 40-watt fire and brimstone about free speech, privilege, “cancelling”, “fashionable nostrums”, “policies inimicable to freedoms”, and people “seeking to expunge large parts of our past”.
In 2,300 words of hufflepuff, the only real-world instances of “dangerous decadence” that he drops in are the defacement of Winston Churchill’s statue during the Black Lives Matter protest in June 2020 (someone spray-painted the words “was a racist” under his name; truly, democracy is finished), “obsessing over pronouns” (another surefire omen of doom) and “seeking to decolonise mathematics”.
I literally work in the news, and this last horseman of the apocalypse was news to me. After a more demanding than usual Google search, I’ve concluded that it refers to a minor kerfuffle in early 2021 over a paper by Californian academics suggesting adding an anti-racist element to the teaching of maths.
Maybe it was a bigger deal in the States. Even so, it didn’t seem to dominate the agenda of vast swathes of the US population for long, much less of anyone further afield.
Let’s be charitable for the moment and assume that these demagogues have simply chosen poor examples to illustrate their point. A second question still needs addressing:
2. If western citizens are misdirecting their energies, what should they be doing instead?
Because if re-examining history, or hanging banners from Marble Arch imploring people to use less fossil fuel, constitutes “dangerous decadence”, if conversations about pronouns are a waste of time, then the implication is that individuals thus occupied should be channelling their efforts into more productive endeavours. Exactly what endeavours, our friends on the right are again reluctant to spell out (unless they’re seriously suggesting we should be spending our days planning multi-trillion-dollar global infrastructure projects and invading France).
My best guess is that what they want us to do is devote 100% of our time and energy to the betterment of the nation (and by nation, of course, what the far-right elites generally mean is them). We should be good little serfs, tilling the fields in the service of our masters, paying our tithes and dying young so as not to be a burden on the state.
And if there is any time left at day’s end after we’ve completed our designated duties, we should devote it to wholesome, morally improving activities, like athletics and shooting and unprotected sex (take that, Great Replacement!). None of this culture rubbish. Culture leads to reflection, and reflection leads to scrutiny.
The underlying message coming through to me, at least, is that we should shut the fuck up, and cease daring to question the status quo that is so endlessly lucrative for them and increasingly harmful to the rest of us.
But such a vast, sustained and coordinated anti-woke operation – even if its thesis is as weak as Dowden’s handshake – seems like overkill if all they are trying to do is silence a few plebs. Which leads me to my final question:
3. What’s really going on?
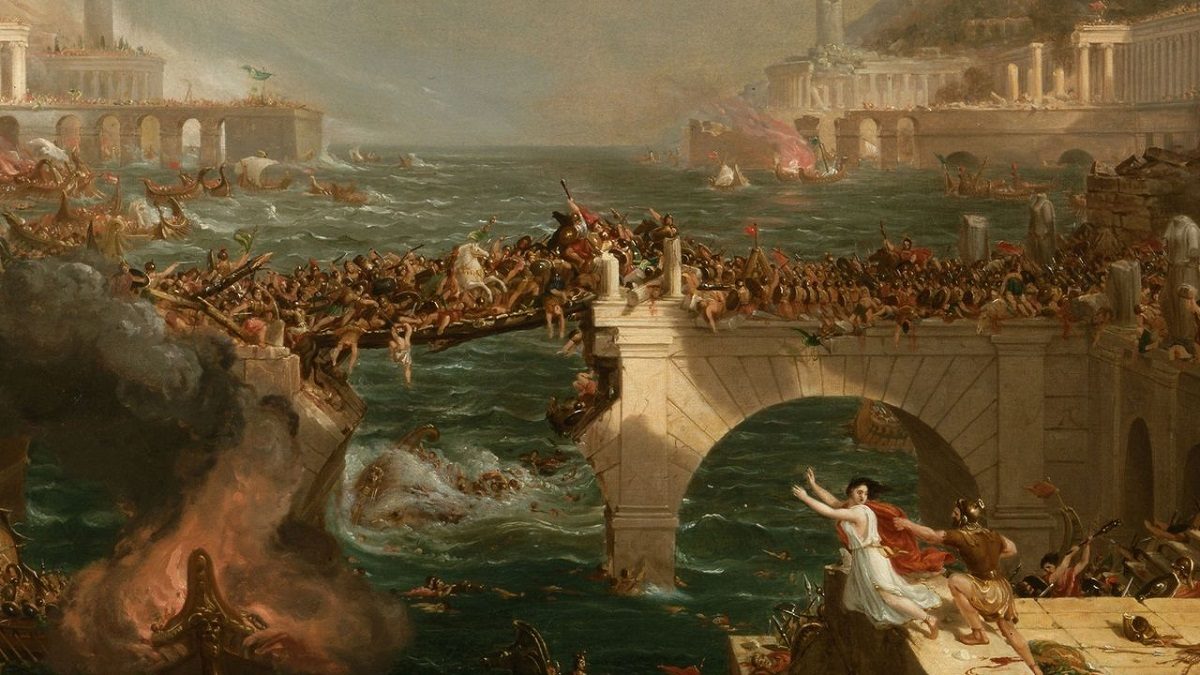
The irony here is that the narrative these prophets are trying to foist on us comes within shouting distance of the truth. Because there is some consensus among historians that decadence was indeed a factor in the erosion or implosion of many of Earth’s great empires (most of the commentators seem to have at least skim-read the Wikipedia entry on Gibbon’s History of the Decline and Fall of the Roman Empire).
But it wasn’t the corruption of everyday folk that was the problem. In Rome, in the Mongol empire, in the Byzantine and the Ottoman, the rot started at the top. Think Caligula building a marble stable for his horse; the petty theological infighting that led to the downfall of the Byzantines; Kublai Khan’s extravagant spending; Suleyman shunning his official duties to spend more time in his harem.
Rome fell not because ordinary citizens were frittering away their days bickering about minor tweaks to the human rights framework, but because their rulers were spending too much time and money feasting, fucking and erecting ever bigger monuments to themselves to run their territories properly; and because, with inequality skyrocketing, the common folk, increasingly vexed at working for peanuts while their overlords bathed in asses’ milk and risking their lives on the battlefield for leaders who kept the lion’s share of the spoils, were less and less inclined to give their all in service of the “greater good”.
Remind you of anything?
If I asked you to point to anyone in the western world in the first quarter of the 21st century who could be said to be charging head first into the abyss of turpitude, where else could you begin but with our leaders? When it comes to lax morals, low standards and all-round malevolence, no student, judge or “wokester” can hold a candle to Oliver Dowden’s Tories and the corporations they serve.
Because in case you hadn’t noticed, the party presently running the UK is now packed to the rafters with councillors, MPs, aides, ministers and peers guilty of deporting longtime legal residents of the UK, plotting to drown and exile asylum seekers, slashing international aid, illegal lobbying, cronyism, filing false expenses claims, tax avoidance, lying, cheating, illegally carousing in a pandemic, excessive drinking, drug-taking, Muslim-bashing, gay-bashing, bishop-bashing, bullying, sexual harassment, sexual assault, rape, treason and murder. These are people, for crying out loud, who have actually tried to depict “do-gooders” as the bad guys and have now described the head of the Church of England as a virtue-signaller.
(Another reason cited by Gibbon for the collapse of Rome – one the faux Christians on the libertarian right oddly seem to skip over – was the rise of fundamentalist Christianity. The devoutly anti-intellectual stance of the church, itself perpetually riven by theological disputes that really did weaken the state and distract people from external threats, stripped away the foundations of culture, philosophy and technological superiority on which the empire had been built. In other words, they’d had enough of experts.)
Ultimately, then, the war on woke seems to be just another deflection tactic.
Authoritarian governments have long invoked bogeymen to frighten the unwary into voting for them, and to give them someone other than the government to blame. But the current bunch are running out of scapegoats.
They can’t blame Labour for the precipitous national decline any more, because Labour hasn’t been in power for 12 years. Nor can they point the finger at the EU, because the UK is free of its “shackles” – not that they’re having much luck finding EU rules they want to scrap anyway. And while the smear campaign against immigrants shows no sign of abating, people are slowly waking up to the overwhelmingly positive net contribution they make to society, largely thanks to the catastrophic labour shortages caused by the exodus of EU workers.
So having exhausted the enemies without, they’re turning their fire on enemies within: charities, judges, lawyers, teachers, students, the Archbishop of Canterbury, and anyone else who has enough time at the end of their day to read a book or the temerity to ask a question. But it should be glaringly obvious to all but the most loyal Daily Mail reader that it’s not Greta Thunberg who’s plotting to usher in the Dark Ages 2.0. The self-appointed harbingers of doom are bringing it themselves.